Linking Flood and Drought Data to Water Safety Planning: Part 4
In Part 3 of this blog series, I briefly discussed how to interpret the suggested datasets, and how to determine if climate conditions are ‘wetter’ or ‘drier’. Two questions remain to be answered, which include identifying those hazards and hazardous events that would be affected by ‘wetter’ or ‘drier’ conditions, and how these conclusions can be incorporated into the WSP process.
1. How do I identify & assess hazards and hazardous events impacting my water utility?
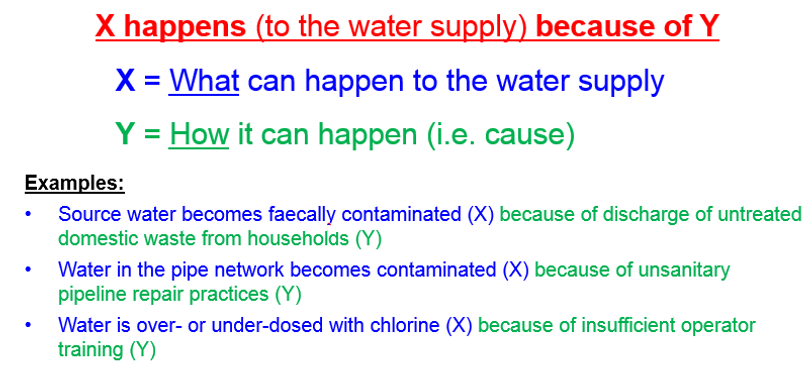
Identifying hazards and hazardous events can be done by, using the WSP teams own knowledge, reviewing the water utility’s current WSP, and through a literature review done by the WSP team. Water utilities may not necessarily need to prepare for those hazards and hazardous events that are associated with ‘wetter’ conditions if their water utility is expected to have ‘drier’ conditions. Hazards and hazardous events should be described using the method below:
After hazards and hazardous events have been described they should be categorised under the physical condition that they may be affected by:
- hazards affected by wetter conditions
- hazards affected by drier conditions
- hazards affected by both wetter and drier conditions
- hazards unaffected by either wetter or drier conditions
Table 1 shows examples of how previously identified hazards and hazardous events were categorised into the above four categories.
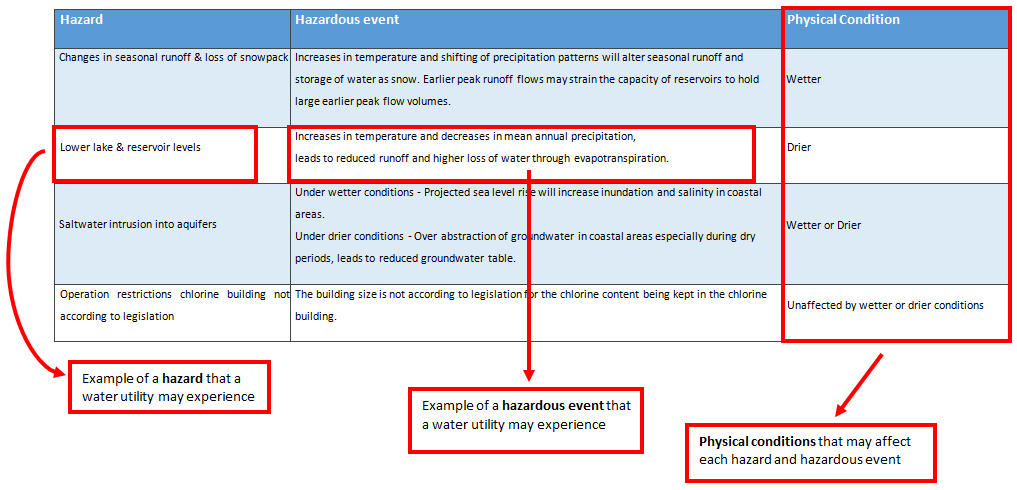
Table 1: Hazards and hazardous events that have been categorised
2. How do I incorporate this into my water safety planning?
After the WSP team has done the analysis to determine if conditions are ‘wetter’ or ‘drier’, these findings need to be incorporated into their WSP. The current risk rating of each hazard and hazardous event has to be known, this can be retrieved from the water utility’s current WSP. Table 2 below indicates the current risk for ‘lower lake and reservoir levels’ which are associated with ‘drier’ conditions.
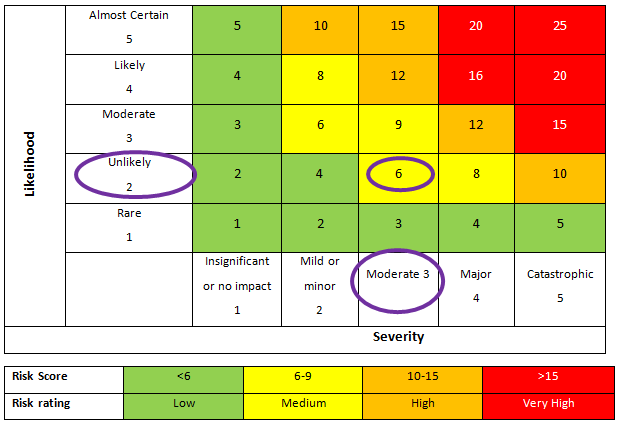
Table 2: Current Risk Matrix
In order to determine how hazards and hazardous events would be affected by climate change, two matrices were developed, including a ‘likelihood change factor matrix’ and a ‘severity change factor matrix’. These matrices are used to indicate by how much the risk rating and risk score for hazards and hazardous events may change under the influence of climate change. The change factors and their application were developed for the purposes of the guidance document.
Example: the WSP team has completed the analysis, and have determined that their water utility is experiencing an overall ‘drier’ trend. Therefore, they should only consider amending those hazards and hazardous events that are affected by drier conditions. The likelihood and severity for rainfall and temperature for a given hazard and hazardous event are as follows:
- Rainfall
- Likelihood:
- 5 out of 12 months had rainfall that exceeded the average/mean.
- 7 out of 12 months had rainfall that were below the average/mean.
- Severity: mildly dry
- Likelihood:
- Temperature
- Likelihood:
- 3 out of 12 months had temperatures that exceeded the average/mean.
- 9 out of 12 months had temperatures that were below the average/mean.
- Severity: near normal
- Likelihood:
Using the above information, the WSP team can determine the change factors for likelihood and severity using the below tables 3 & 4.
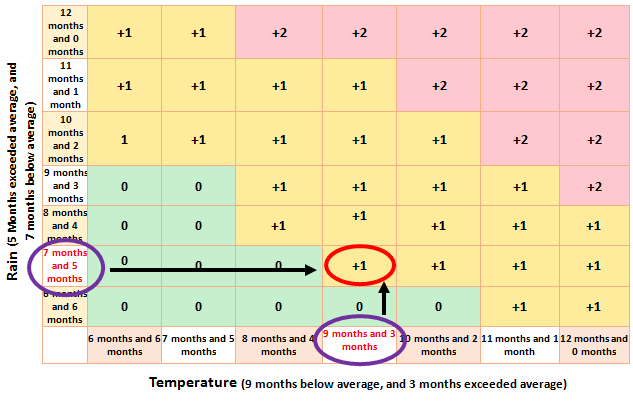
Table 3: Likelihood change factor matrix
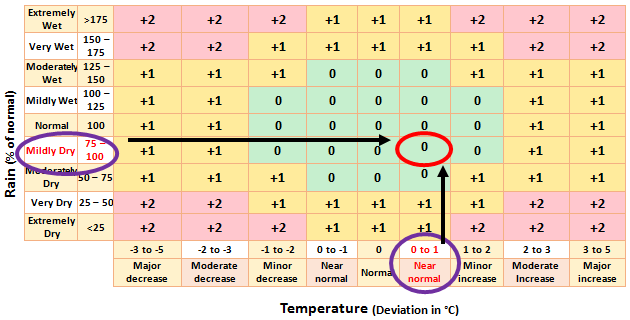
Table 4: Severity Change factor matrix
The change factors determined using the above matrices should be added to the current risk scores (Table 5).

Table 5: Adding change factors to current likelihood and severity
The new risk score can be put into the WSP risk matrix. This will indicate how the risk score and rating have changed. These change factors should be applied to each hazard and hazardous event affected by the associated physical condition. The risk score has increased from 6 to 9 the hazard and hazardous event (Table 6).
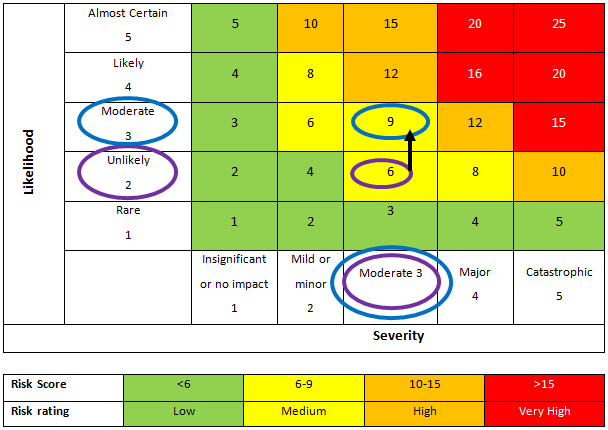
Table 6: New risk rating
The change in the ‘new’ risk score and indicates that the effects of the hazard and hazardous event may have worsened under the physical conditions, and the water utility may have to consider taking action to limit the impact thereof.
About the Flood and Drought Management Tools project
The Flood and Drought Management Tools (FDMT) project funded by the Global Environment Facility (GEF) International Waters (IW) and implemented by UN Environment (UNEP), with DHI and the International Water Association (IWA) as the executing agencies. The project is developing online technical applications to support planning from the transboundary basin to water utility level by including better information on floods and droughts. The project is being implemented from 2014 – 2018, with 3 pilot basins (Volta, Lake Victoria and Chao Phraya) participating in development and testing of the methodology and technical applications.
For more information on the Flood and Drought Management Tools project, visit: http://fdmt.iwlearn.org.
_________
A series of webinars on the theme of Climate Smart Utilities will be held over the next few months including:
- “Interpreting climate information for water utilities” on 25 October 2018 (watch the recording here)
- “Climate resilient water safety planning” on 28 November 2018
- “Vision to action, how to build climate resilient water utilities” – date to be determined